Each fall, the Consortium for the Advancement of Undergraduate Statistics Education (CAUSE) and the American Statistical Association host the Undergraduate Class Project Competition. Teams from across the globe submit projects completed in an introductory or intermediate statistics class, which are then judged on their accuracy, clarity and significance.
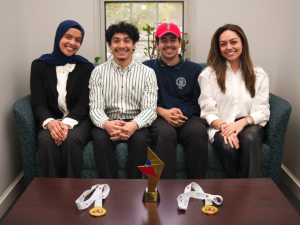
In 2020, Duke students, mentored by professors Maria Tackett and Yue Jiang, swept the top three places of the introductory category, along with both honorable mentions. But even more impressive than the wins were the breadth of projects included. They covered the impact of COVID-19 on domestic violence and EMS calls, racial disparities in traffic stops, resiliency in children who suffer maltreatment and the correlation of between education rates and life expectancy.
The wide array of topics—and the fact that undergraduate students are doing real-world research in all of them—are indicative of the Department of Statistical Science as a whole.
“Statisticians are like scientific detectives,” said Jerry Reiter, who chairs the department. “There’s some truth in data, and we use mathematics, computation, understanding of science and communication skills to find that truth. Our students and faculty work on projects with pretty much every department on campus.”
To see how true that is, you only have to review the thesis projects seniors wrote this year and the careers they are leading to.

Anna Darwish started with a simple question during a class project, driven by the fact that both of her parents are doctors on the frontlines of COVID: who is following social distancing protocols? Using survey data from Duke’s Social Science Research Institute, Darwish extended that project into an honors thesis, examining how adherence rates differed among various demographic groups and how political affiliation impacted rates within each demographic.
“The immediate implication is that you could estimate, within a given population, how well people will be socially distancing,” Darwish says. “It might help with predicting the number of cases. And if political affiliation was significant, it means there might be a necessity to create a stronger protocol for the way people speak about COVID.”
In fact—despite complications with a high number of incomplete surveys—that’s just what Darwish found: Republicans were slightly less likely to socially distance. But that wasn’t the only factor. Another was the relationship between age and race. “Some older groups were more likely to socially distance than their younger counterparts, but it depended on the race/ethnic identity,” Darwish explains.
Now that she has graduated, Darwish will use her statistical skills, alongside the knowledge she gained from a second major in Computer Science, as a software engineer at Microsoft. But writing a thesis sparked a passion for research, so Darwish is also making plans to return for a Ph.D. in statistics en route to becoming a professor.
Darwish is far from alone in pairing statistics with computer science: it’s a common combination for students who like math and want to focus on data-centric applications. Malavi Ravindran is another. She came to Duke intending on a math major, but while taking Introduction to Data Science and Statistical Thinking alongside a multivariable calculus class, she had a realization.
“I noticed the math clicking for others in a way it wasn’t for me,” Ravindran says. “I thought, maybe I do want to continue with math, but pure math isn’t the way for me to go about it. And concurrently, I was doing this very applied stats class where we were actually coding in R [a statistics software] and making visualizations and working with real data.”
When COVID-19 cancelled her planned summer internship, Ravindran found one with online education company Coursera through Project Phoenix. But it was only a few hours a day, so she also applied to help with statistics research projects on Muser. She eventually found one, and that project grew into her own thesis.
It involves a branch of statistics called “survival analysis,” which predicts the amount of time that will elapse before some outcome occurs, like death from a disease or mechanical failure in a machine. Though Ravindran analyzed ovarian cancer data in the project, her focus was less about health outcomes and more about statistical methodology.
She was looking for a way to analyze datasets with a large number of variables—like sex, age, genetic background and more in medical patients—in order to pinpoint the impact of each variable, so she examined a method called “latent-factor modeling.” “It’s a way to reduce them down to a smaller set,” Ravindran says. “Once you have this smaller number of latent factors, then it’s easier to understand interaction effects between them.”
As it turns out, that method may come in handy: Ravindran will join Coursera’s data science team, helping get more people to sign up for classes and stay in them to the end. It’s survival analysis all over again, just in a different field.

The same class that inspired Ravindran also inspired Ethan Shen. He had planned on an economics major, but after taking Introduction to Data Science, he realized statistics offered the balance of theory and application he was looking for.
“There are a lot times where we’ll learn to prove things and derive things,” Shen says, “but also how you can apply this theory to any field or real-world example. That’s why I was drawn to it.”
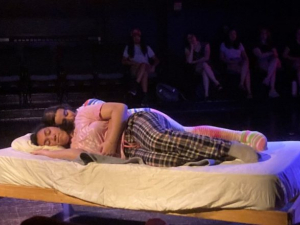
While studying abroad in Greece after his first year at Duke, Shen found an unexpected topic to use as an example: soccer. Inspired by the excitement around World Cup games and the Champions League final, he developed a new passion for the sport, which eventually became his honors thesis.
Shen examined the pace of play in the top five European soccer leagues, analyzing which teams play fastest and when. But doing so requires defining what “pace” means and what counts as a possession for each team.
“The classic way is passes between teammates,” Shen says. “But if you look at it that way, passes between two defenders would be weighted equally with a pass between a midfielder or a winger. And that first pass means nothing because you’re in your own half and you’re not really creating a chance [to score] or anything.”
Instead, Shen measured pace of play by taking into account the velocity of each pass. He found that teams play fastest in their attacking area, and that those findings are consistent across the five leagues. Perhaps unexpectedly, he also found that the worse teams are, the faster they play. But that’s the result of his definition of pace.
“For [better] teams to maintain possession for a longer period of time, it makes sense for them to play shorter passes,” Shen says. “Those passes are more likely to be completed than a long cross. But if a team takes shorter passes, then their pace would be slower.”
After Duke, Shen will join the financial markets advisory team at the financial planning and asset management company BlackRock. But his dream is to eventually work as an analyst for a professional soccer team, which will likely require a graduate degree in statistics.
Another student going on to graduate school studied the role statistics can play in social justice.
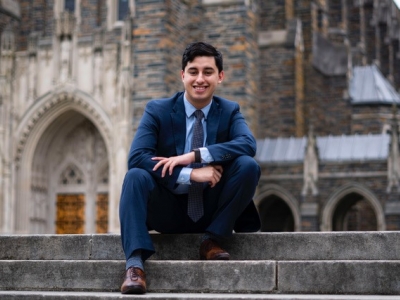
Steven Herrera Tenorio is an immigrant from Guatemala who grew up in the small town of Sanford, North Carolina. Drawn to math early—“I was an [English as a Second Language] student, so I never considered myself someone who was a good writer or reader,” he says—he chose to major in statistics because of its interdisciplinary nature.
Originally on a path to the tech industry, Herrera Tenorio interned at the Twitter headquarters in San Francisco after his sophomore year. But it was not the experience he expected. “I was not used to living in a big city like that,” he says. “What particularly stood out to me was gentrification, segregation and homelessness. I grew up low income and not understanding, but I made more money in that summer than my parents did the entire year.”
Rethinking his career plans in light of his encounter with rampant inequality, Herrera Tenorio discovered an interest in sociological research. Inspired by his conversations with Latina mothers navigating the Bay Area’s tech hubs, he began looking into theories of assimilation and neighborhood segregation. That research morphed into Herrera Tenorio’s thesis, which was written outside of the Department of Statistical Science but with their support.
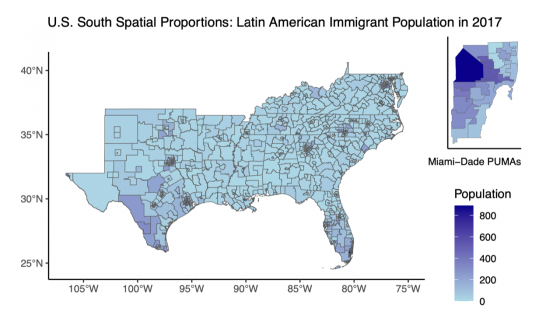
Called “The Nuevo South: A Latent Class Analysis of Neighborhood Integration Among Latin American Immigrants in the U.S. South, 2012–2018,” it statistically investigates three different theories of how Latin American immigrants choose their neighborhoods. “I’m not predicting which neighborhood they’ll move into,” Herrera Tenorio says, “I’m measuring which qualities of this neighborhood enticed them to move there in the first place, and if that is motivated by race and socioeconomic factors specifically.”
To do that, Herrera Tenorio used a method called “latent class analysis” in order to measure which neighborhoods are desirable or not. That measure allows him to account for whether immigrants are choosing to live in certain places or forced to live there by racism, poverty or other forms of discrimination. “That’s when it gets really, really difficult to measure these outcomes,” he says.
It's just those kinds of big, tricky questions that Herrera Tenorio will take on after Duke as he begins a joint Ph.D. in sociology and demography at the University of California, Berkeley. But he’s clear that his statistics background will be crucial to his sociological work.
“You’ll always need a statistician,” he says.